Plotting in a Python notebook.
Three things before you can plot.
- you tell Jupyter that you want plots to appear inline
- you load in numerical Python so you can deal with numerical arrays
- you load in PyPlot to do your plotting.
This is done with the following code:
%matplotlib inline
import numpy as np
import matplotlib.pyplot as plt
You don't need to use the "as np" or the "as plt" but it helps to keep the namespace clean. So when you call functions like "sin" you need to say where it comes from, as in "np.sin"
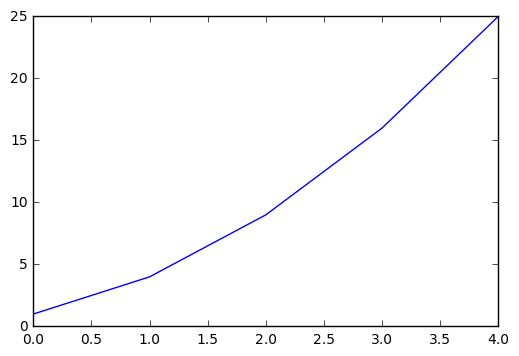
Now, to plot a few numbers, you just call the plot function, with the numbers as an array:
plt.plot([1,4,9,16,25])
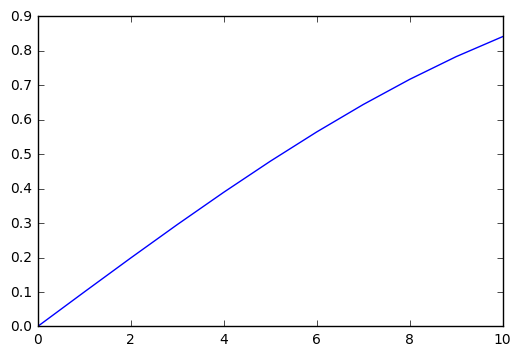
You can plot a piece of the sine function in a similar manner, passing a list of numbers to the sin function:
plt.plot(np.sin([0,.1,.2,.3,.4,.5,.6,.7,.8,.9,1.0]))
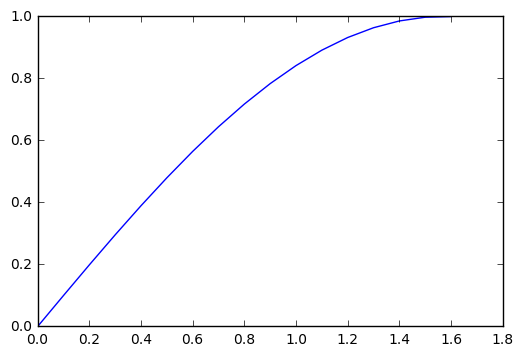
Usually you want to plot x and y values together, which you can do as follows:
x = [0,.1,.2,.3,.4,.5,.6,.7,.8,.9,1.0,1.1,1.2,1.3,1.4,1.5,1.6];
y = np.sin(x);
plt.plot(x,y)