Plotting with PyPlot
In Julia, the PyPlot package will be most familiar to users of Python's PyPlot package, as well Matlab users. Unlike Python, no "magic" commands are needed to get Julia to plot onto the Jupyter notebook page.
To learn more about the PyPlot package for Julia, refer to the Github repo:https://github.com/JuliaPy/PyPlot.jl
To start, begin with the "using" command to inform Julia that you wish to use the PyPlot package.
using PyPlot
To plot an array of numbers, simply use the "plot" command.
plot([1,2,3,4])
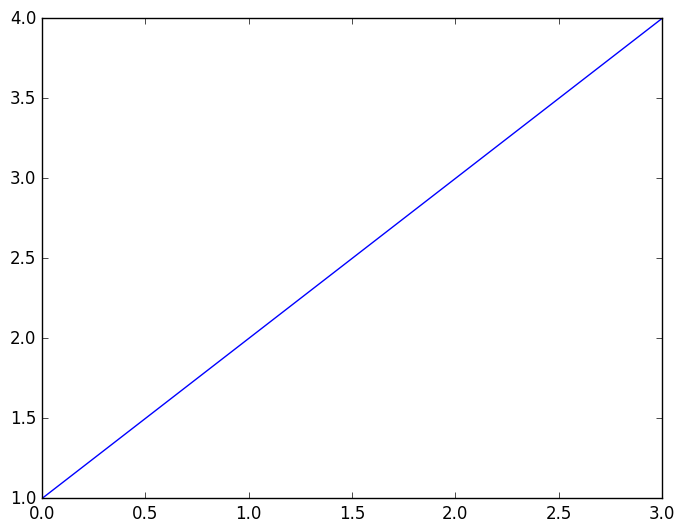
1-element Array{Any,1}:
 PyObject <matplotlib.lines.Line2D object at 0x7f6e338e1cf8>
To plot y versus x values, put them both into the plot command.
x = linspace(-3, 3)
y = x.^3 - 3*x
plot(x,y)
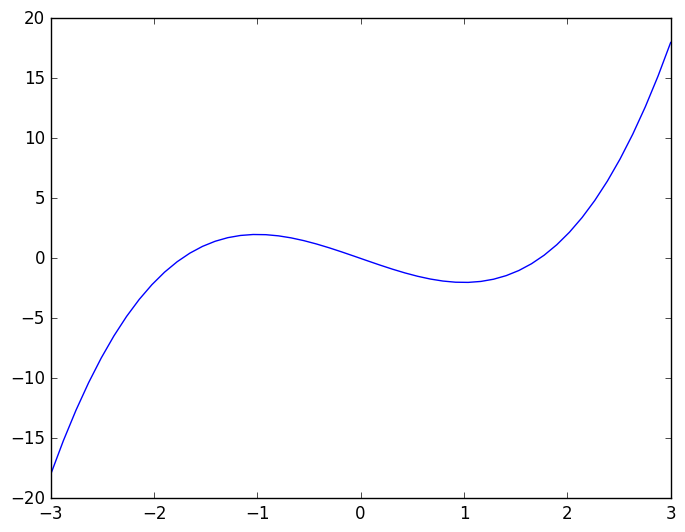
1-element Array{Any,1}:
 PyObject <matplotlib.lines.Line2D object at 0x7f6e3387cbe0>
To plot a surface, creat your x and y variables, expand to a grid, and use this to define the z values on the surface
n = 100
x = linspace(-3, 3, n)
y = linspace(-3,3,n)

xgrid = repmat(x',n,1)
ygrid = repmat(y,1,n)

z=exp(-xgrid.^2 - ygrid.^2)

plot_surface(x,y,z)
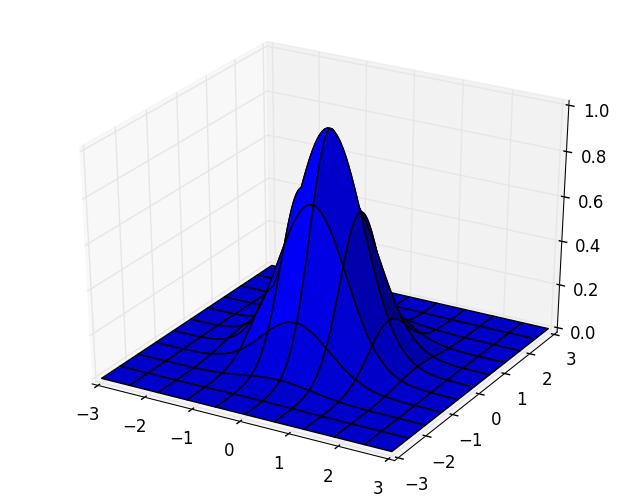
PyObject <mpl_toolkits.mplot3d.art3d.Poly3DCollection object at 0x7f6e330b1550>
You might like to color your surface plot with a color map:
plot_surface(x,y,z,cmap="jet")
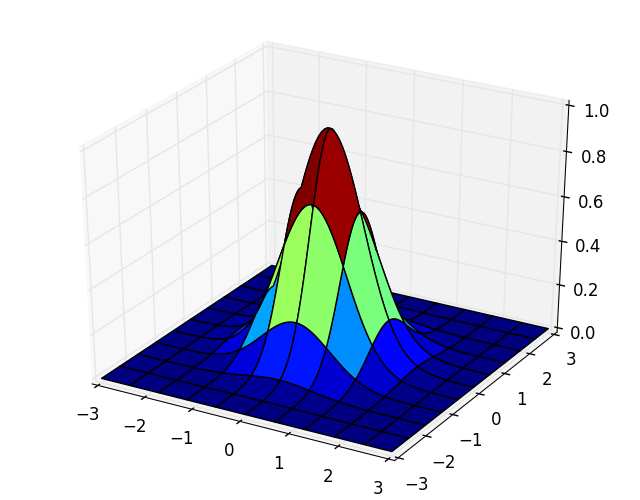
PyObject <mpl_toolkits.mplot3d.art3d.Poly3DCollection object at 0x7f6e337812e8>
To plot this surface instead as an image, use the "imshow" command, which is somewhat like "imagesc" in Matlab.
imshow(z)
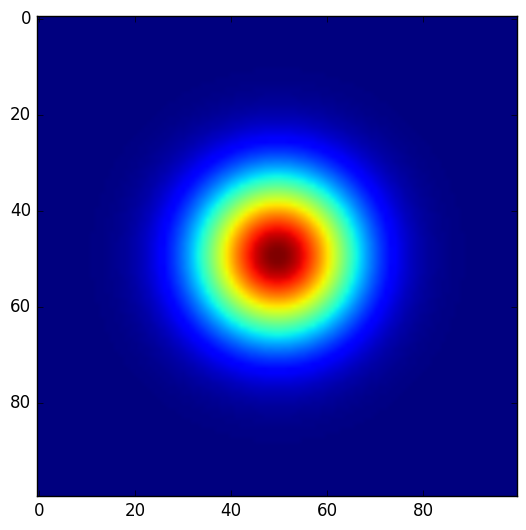
PyObject <matplotlib.image.AxesImage object at 0x7f6e336a7be0>