High resolution graphics into files
Very often we need to create some high resolution graphics in a computing environment and then export it in a file, to use within some other application. For instance, a book may need a high quality diagram that is best created by some algorithm.
This section demonstrates a simple technique to do this.
The basic idea is to create a Scalable Vector Graphics file (of type .svg) and fill it with text commands that indicate what to draw for the graphics image. You can read more details of all that can be draw here: https://en.wikipedia.org/wiki/Scalable_Vector_Graphics
WARNING: images displayed are often "cached" by your browser (Firefox, Chrome, Safari, etc), which means the file is pre-loaded for convenience. However, if your Jupyter code changes the .svg file, the browser does not know to re-draw the new image. One way to force it to draw the new image is to re-load the page. (Remember to save first.)
Example 1 - Two lines
In this example, we will simply draw a couple of lines. The file will have four text entries. The first entry marks the file as an svg file, the last entry indicates the end of the svg file. Two entries in the middle draw two lines. The text will look like this:
<svg xmlns='http://www.w3.org/2000/svg' version='1.1' width='100%' height='100%' viewBox='-1  -1 2 2'>
<line x1='-1' y1='1'  x2='1' y2='-1' stroke='black' stroke-width='.01' />
<line x1='-1' y1='-1' x2='1' y2='1' stroke='red' stroke-width='.01' />
</svg>
We use the "open" command in Julia to open a file, and write into it with the "write command." Note we use a "do" look to ensure that the file is closed once the writing is all done.
open("simplegraphics.svg","w") do f
    write(f,"<svg xmlns='http://www.w3.org/2000/svg' version='1.1' width='100%' height='100%' viewBox='-1  -1 2 2'> \n")
    write(f,"<line x1='-1' y1='1'  x2='1' y2='-1' stroke='black' stroke-width='.01' /> \n")
    write(f,"<line x1='-1' y1='-1' x2='1' y2='1' stroke='red' stroke-width='.01' /> \n")
    write(f,"</svg>")
end
6
To display the file, we use either of these two Markdown commands:

<img src="simplegraphics.svg" width="500" height="500">
The second choice gives you a bit more control over the size of the output.

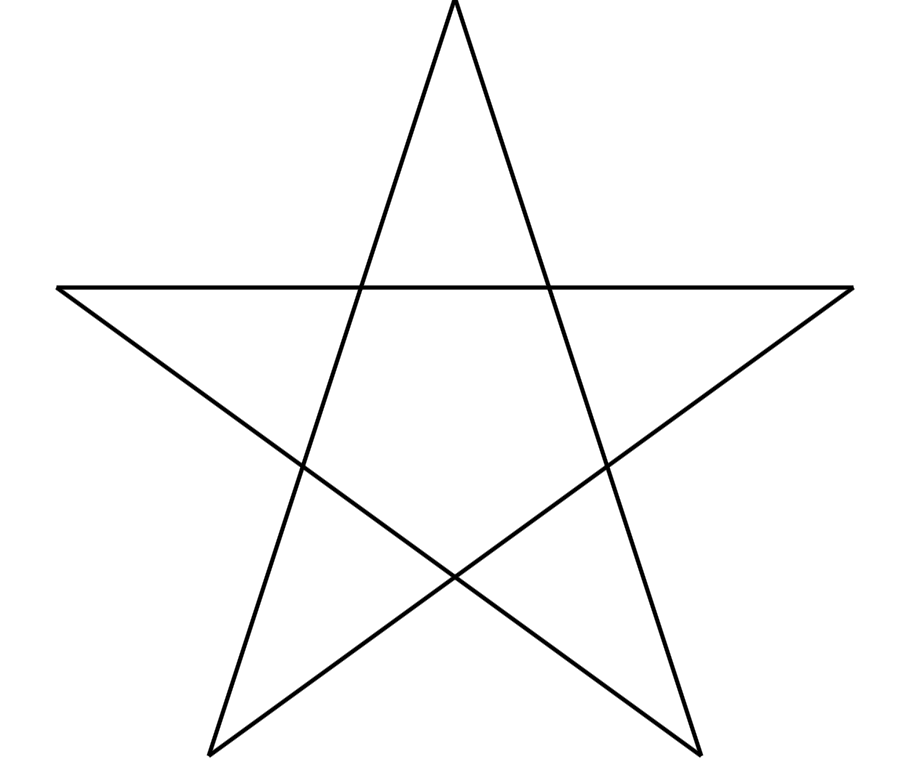
Example 2 - A star is born
Here is a slightly more interesting example. We draw a five-pointed star by connecting lines across 5 evenly spaced points on a circle. This is probably more fun to do algorithmically like this, rather than trying to do a freehand drawing of a star.
open("star.svg", "w") do f
    write(f,"<svg xmlns='http://www.w3.org/2000/svg' version='1.1' width='100%' height='100%' viewBox='-1  -1 2 2'> \n")
    for i in 1:5
        x1 = sin(i*2*pi/5)
        y1 = -cos(i*2*pi/5)
        x2 = sin((i+2)*2*pi/5)
        y2 = -cos((i+2)*2*pi/5)
        write(f,"<line x1='$x1' y1='$y1'  x2='$x2' y2='$y2' stroke='black' stroke-width='.01' /> \n")
    end
    write(f,"</svg>")
end
6
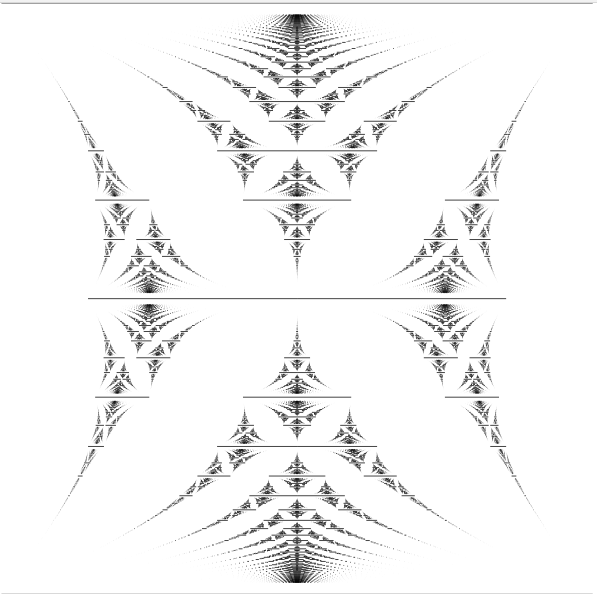
Example 3 - Mathieu Spectra
We construct spectra for the almost Mathieu operator, also known as the Hofstadter Butterfly. https://en.wikipedia.org/wiki/Hofstadter's_butterfly
Personally, I've done this before using MATLAB, taking a lot of care to make it fast. Here in Julia, it seems to be fast even without any special tricks. In particular, I leave the matrices U,V, in their natural form, and compute directly in their full matrix form.
This code creates a file mathieu.svg which can be opened directly in Jupyter Hub using the browser. In fact, the image opened separately looks better than the display here.
The Math
The almost Mathieu operator describes the energy levels of an electron moving in a periodic crystal (2D), under the influence of a magnetic fields. This causes only certain energy levels to be allowed, depending on a parameter
We take two universal unitaries which satisfy a commutation relation
The related energy operator (almost Mathieu operator) is the linear, self adjoint operator
The curious thing is that the spectrum of is either a union of intervals, or a Cantor set, depending on whether is rational or irrational. Which seems odd in physics, that a tiny perturbation in one parameter should give such a fundamental change in the nature of the spectra.
In the case where is rational, we can compute the spectrum exactly.
We define here two unitaries and that are matrices. is a diagonal matrix, while is a permutation matrix. They satisfy the fundamental intertwining identity
Replacing by a scalar multiple will satisfy the same commutation constraint. Setting gives one extreme set of spectral points, that form one-half of the interval endpoints that make up the spectrum. Setting gives the other extreme set, forming the other set of endpoints.
The code
The matrix defined below is the self adjoint sum of these unitaries, and has constants thrown in to get the other extreme points of the spectra.
We compute the eigenvalues, then throw them into a file that plots all the lines.
U(p,q) = diagm(exp(2*pi*1im*(1:q)*p/q))
V(p,q) = circshift(eye(q),(0,1))
H(p,q) = U(p,q)+U(p,q)' + V(p,q)+V(p,q)'
L(p,q) = exp(pi*1im/q)*U(p,q)+exp(-pi*1im/q)U(p,q)' + exp(pi*1im/q)*V(p,q)+exp(-pi*1im/q)*V(p,q)'
eigH(p,q) = eig(H(p,q))[1]
eigL(p,q) = eig(L(p,q))[1]
eigL (generic function with 1 method)
function printaline(f,xone,xtwo,y)
    y8 = y*8
    print(f,"<line x1='$xone' y1='$y8' x2='$xtwo' y2='$y8' stroke='black' stroke-width='.01' /> \n")
end
printaline (generic function with 1 method)
f = open("mathieu.svg","w")
print(f,"<svg xmlns='http://www.w3.org/2000/svg' version='1.1' width='100%' height='100%' viewBox='-4  0 8 8'> \n")
printaline(f,-4,4,0)
printaline(f,-4,4,1)
for q=2:50
    for p= 1:(q-1)
        if gcd(p,q)==1
            eig1 = eigH(p,q)
            eig2 = eigL(p,q)
            for k=1:q
                printaline(f,eig1[k],eig2[k],p/q)
            end
        end
    end
end
print(f,"</svg> \n")
close(f)
We now display the spectra using the image command in Markdown language.
<img src="mathieu.svg" width="600" height="600">