Plotting with Gadfly
The Gadfly package for Julia is a very nice plotting package that allows interactive control of the plots from within the notebook. According to the documentation, it is based largely on Hadley Wickhams's ggplot2 (http://ggplot2.org/) for R and Leland Wilkinson's book The Grammar of Graphics (https://www.cs.uic.edu/~wilkinson/TheGrammarOfGraphics/GOG.html). It was Daniel C. Jones' brainchild and is now maintained by the community.
Details on the package are here: http://gadflyjl.org/stable/index.html
To start using Gadfly, use the "using" command to inform Julia that you want to use this package.
using Gadfly
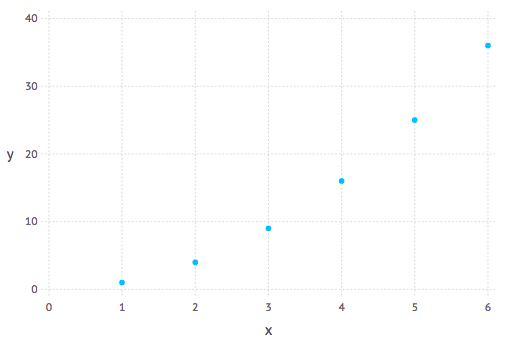
Use the plot command to plot x and y values. Clicking on the graph gives you access to controls to pan and zoom.
plot(x=[1,2,3,4,5,6],y=[1,4,9,16,25,36])
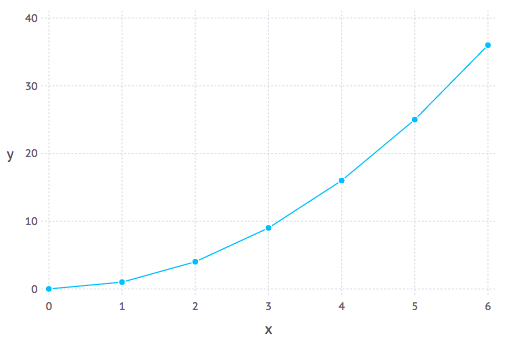
A few details line lines and points can be added explicitly to the plot, as follows.
plot(x=[0,1,2,3,4,5,6], y=[0,1,4,9,16,25,36], Geom.point, Geom.line)
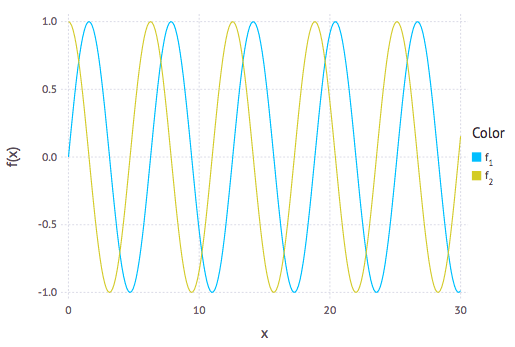
Gadfly even knows how to plot functions directly, as in this example.
plot([sin, cos], 0, 30)
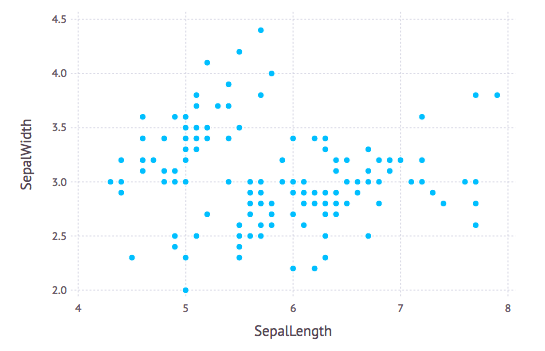
Gadfly excels at plotting data from large data sets. Here we load in some standard R data sets and plot the information therein.
using RDatasets
plot(dataset("datasets", "iris"), x="SepalLength", y="SepalWidth", Geom.point)
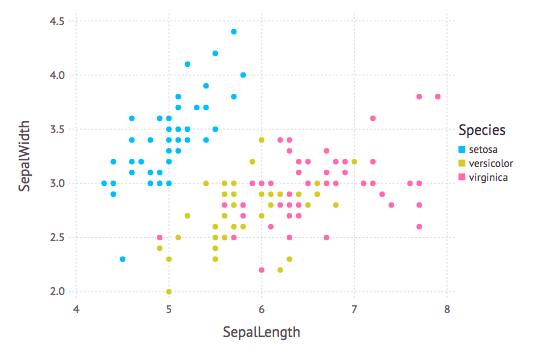
An alternate way is to assign a variable with a particular data set (the iris data set, which is information about a collectin of flowers) and plot.
iris = dataset("datasets", "iris")
plot(iris, x=:SepalLength, y=:SepalWidth, color=:Species, Geom.point)